Academics
Careers
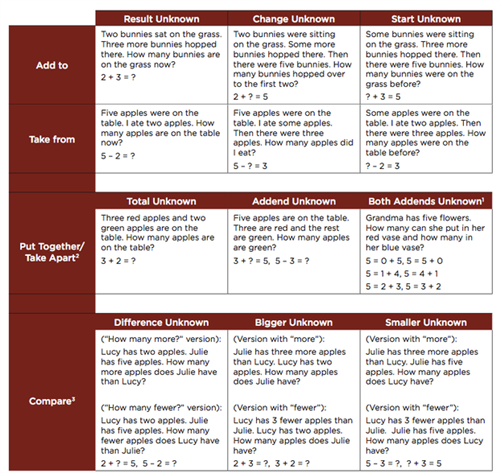
Addition, subtraction, multiplication, and division problems can be posed in many different ways. Students must be able to solve problems of any situation.
Problem Solving everyday
Problem solving is not an isolated activity. It doesn't occur every Friday. Instead problem solving is a skill that favors every mathematics lesson. Problem solving is more than just one-step word problems. Problem solving should feature risk tasks, authentic purposes, and multiple ways to be solved.
More than Words
Solving problems goes beyond mathematics presented as word or story problems. Problem solving is the act of finding a solution when a method for solution is not obvious. It can be story problems or simply open-ended questions. These problem solving decks from the North Carolina State Department of Education offer wonderful opportunities for thinking and solving problems.
Avoiding key words
1. Key words are misleading. Some key words typically mean addition or subtraction. But not always. Consider: There were 4 jackets left on the playground on Monday and 5 jackets left on the playground on Tuesday. How many jackets were left on the playground? "Left" in this problem does not mean subtract.
2. Many problems have no key words. For example, How many legs do 7 elephants have? does not have a key word. However, any 1st grader should be able to solve the problem by thinking and drawing a picture or building a model.
3. It sends a bad message. The most important strategy when solving a problem is to make sense of the problem and to think. Key words encourage students to ignore meaning and look for a formula. Mathematics is about meaning (Van de Walle, 2012).
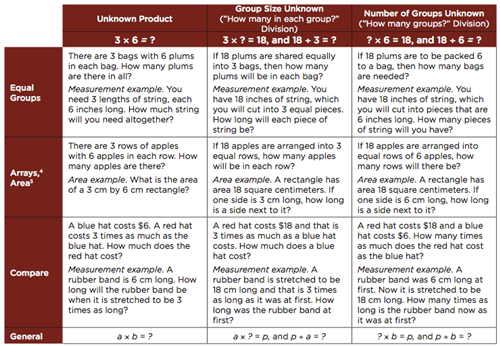
The Common Core Problem Solving Situation documents are below. They describe the various types of problems that students in grades K-5 should have experience making sense of, persevering through, and solving. The first table contains the situations for addition and subtraction. The next table contains the situations for multiplication and division. Kindergarten, First, and Second grade students work to solve problems involving addition and subtraction. Third and Fourth Grade students continue to solve problem involving addition and subtraction, but they also solve problems using multiplication and division.
Using models is a critical step in helping students transition from concrete manipulative work with word problems to the abstract step of generating an equation to solve contextual problems. By learning to use simple models to represent key mathematical relationships in a word problem, students can more easily make sense of word problems, recognize both the number relationships in a given problem and connections among types of problems, and successfully solve problems with the assurance that their solutions are reasonable.
Importance
Why is modeling word problems important?
Students often struggle with word problems. Many students just seem to look for some numbers and do something with them, hoping they solve the problem.
Students must develop the habit of first making sense of the problem. A diagram or model often puts the focus on making sense of the problem instead of just getting an answer. The model then can be used to generate a thoughtful equation. The model and the equation can be used as a reasoning check once a student has a solution.
Problem solving does not stop with the answer. The process must continue after the "answer getting" to reasoning about whether the answer makes sense.
What is modeling word problems?
Models at any level can vary from simple to complex, realistic to representational. Young students often solve beginning word problems, acting them out, and modeling them with the real objects of the problem situation, e.g. teddy bears or toy cars. Over time they expand to using representational drawings, initially drawing pictures that realistically portray the items in a problem, and progressing to multi-purpose representations such as circles or tally marks. After many concrete experiences with real-life word problems involving joining and separating, or multiplying and dividing objects, teachers can transition students to inverted-V and bar model drawings which are multi-purpose graphic organizers tied to particular types of word problems.
Modeling Basic Number Relationships
Simple diagrams, sometimes known as number bonds, fact triangles, situation diagrams, or representational diagrams are appearing more frequently in curriculum materials. But students' problem solving and relational thinking abilities would benefit by making more routine use of these diagrams and models.
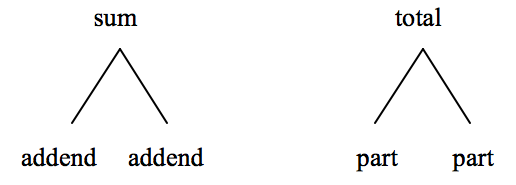
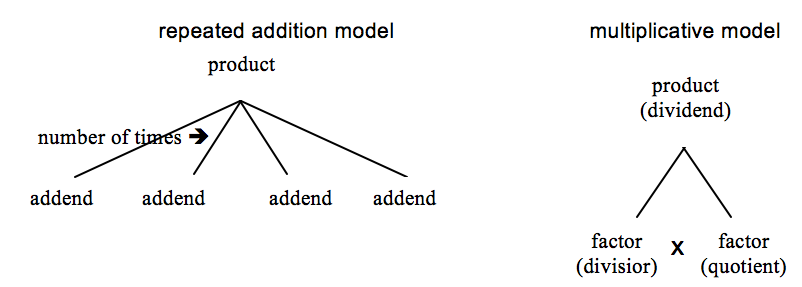
Young children can begin to see number relationships that exist within a fact family through the use of a model from which they derive equations. The number bond and the inverted-V is one simple model that helps students see the addition/subtraction relationships in a fact family, and can be used with word problems requiring simple joining and separating. The number bond and then the inverted-V model can be adapted for multiplication and division fact families. For addition, students might think about the relationships among the numbers in the inverted-V in formal terms, addend and sum, or in simpler terms, part and total, as indicated in the diagrams below.
A specific example for a given sum of 10 would be the following, depending on which element of the problem is unknown.
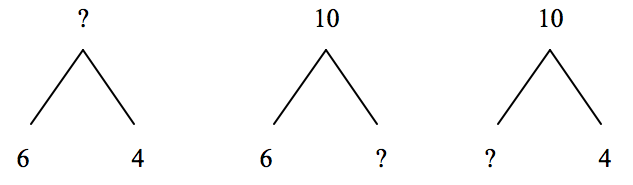
6 + 4 = ? 6 + ? = 10 ? + 4 = 1
4 + 6 = ? 10 - 6 = ? 10 - 4 = ?
While often used with fact families, and the learning of basic facts,the number bond and inverted-V diagrams can also work well with solving word problems. Students need to think about what they know and don't know in a word problem - are both the parts known, or just one of them? By placing the known quantities correctly into the inverted-V diagram, students are more likely to determine a useful equation for solving the problem, and see the result as reasonable for the situation. For example, consider the following problem:
Zachary had 10 train cars. Zachary gave 3 train cars to his brother. How many train cars does Zachary have now?
Students should determine they know how many Zachary started with (total or whole), and how many he gave away (part of the total). So, they need to find out how many are left (other part of the total). The following inverted-V diagram represents the relationships among the numbers of this problem:
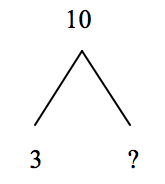
3 + ? = 10 or 10 - 3 = ?, so Zachary had 7 train cars left.
As students move on to multiplication and division, the inverted-V model can still be utilized in either the repeated addition or multiplicative mode. Division situations do not require a new model; division is approached as the inverse of multiplication or a situation when one of the factors is unknown.
Again, the inverted-V diagram can be useful in solving multiplication and division word problems. For example, consider the following problem:
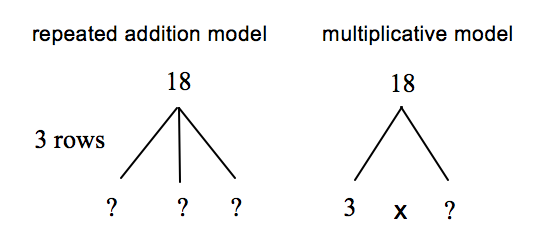
Phong planted 18 tomato plants in 3 rows. If each row had the same number of plants, how many plants were in each row?
Students can see that they know the product and the number OF rows. The number IN A row is unknown. Either diagram below may help solve this problem, convincing students that 6 in a row is a reasonable answer.
While the inverted-V diagram can be extended to multi-digit numbers, it has typically been used with problems involving basic fact families. Increasing the use of the inverted-V model diagram should heighten the relationship among numbers in a fact family making it a useful, quick visual for solving simple word problems with the added benefit of using and increasing the retention of basic facts.
Models and Problem Types for Computation
As children move to multi-digit work, teachers can transition students to tape diagram/bar model drawings, quick sketches that help students see the relationships among the important numbers in a word problem and identify what is known and unknown in a situation.
By introducing students to bar models a teacher has an important visual to facilitate student thinking about the mathematical relationships among the numbers of a given word problem.
With tape diagram/bar model the relationships among numbers in all these types of problems becomes more transparent, and helps bridge student thinking from work with manipulatives and drawing pictures to the symbolic stage of writing an equation for a situation. With routine use of diagrams and well-facilitated discussions by teachers, student will begin to make sense of the parts of a word problem and how the parts relate to each other.
Part-Part-Whole Problems. Part-Part-Whole problems are useful with word problems that are about sets of things, e.g. collections. They are typically more static situations involving two or more subsets of a whole set. Consider the problem,
Cole has 11 red blocks and 16 blue blocks. How many blocks does Cole have in all?
Students may construct a simple rectangle with two parts to indicate the two sets of blocks that are known (parts/addends). It is not important to have the parts of the rectangle precisely proportional to the numbers in the problem, but some attention to their relative size can aid in solving the problem. The unknown in this problem is how many there are altogether (whole/total/sum), indicated by a bracket (or an inverted-V) above the bar, indicating the total of the 2 sets of blocks. The first bar model below reflects the information in the problem about Cole's blocks.
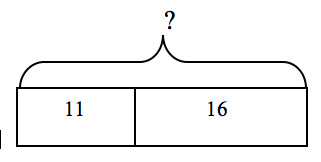
11 + 16 = ? so Cole has 27 blocks in all.
A similar model would work for a problem where the whole amount is known, but one of the parts (a missing addend) is the unknown. For example:
Cole had 238 blocks. 100 of them were yellow. If all Cole's blocks are either blue or yellow, how many were blue?
The following bar model would be useful in solving this problem.
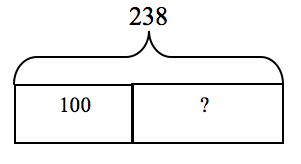
100 + ? = 238 or 238 - 100 = ? so Cole has 138 blue blocks.
The answer has to be a bit more than 100 because 100 + 100 is 200 but the total here is 238 so the blue blocks have to be a bit more than 100.
The part-part-whole bar model can easily be expanded to large numbers, and other number types such as fractions and decimals. Consider the problem:
Leticia read 7 ½ books for the read-a-thon.She wants to read 12 books in all. How many more books does she have to read?
The first diagram below reflects this problem. Any word problem that can be thought of as parts and wholes is responsive to bar modeling diagrams. If a problem has multiple addends, students just draw enough parts in the bar to reflect the number of addends or parts, and indicate whether one of the parts, or the whole/sum, is the unknown, as shown in the second figure below.
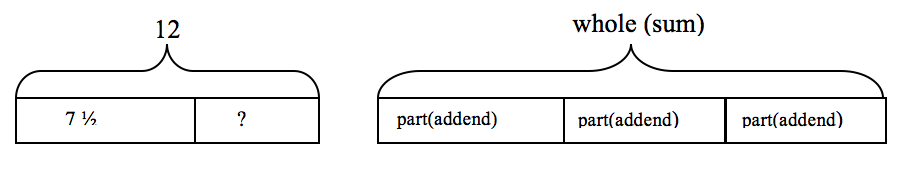
12 - 7 ½ = ? or 7 ½ + ? = 12 so Leticia needs to read 4 ½ more books.
Join (Addition) and Separate (Subtraction) Problems.
Students who struggle with deciding whether they need to add or subtract, or later to multiply or divide, find the organizing potential of the bar model incredibly helpful.
Maria had $20. She got $11 more dollars for babysitting. How much money does she have now? Consider this joining problem:
Students can identify that the starting amount of $20 is one of the parts, $11 is another part (the additive amount), and the unknown is the sum/whole amount, or how much money she has now. The first diagram below helps represent this problem.
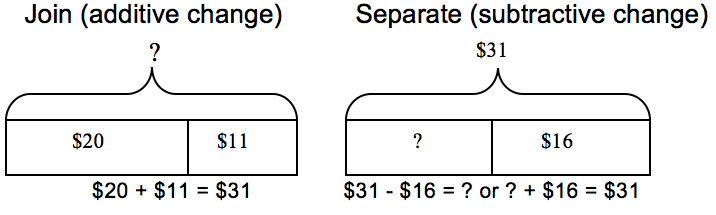
Consider the related subtractive situation:
Maria had $31. She spent some of her money on a new CD. Maria now has $16 left.
The second diagram above represents this situation. Students could use the model to help them identify that the total or sum is now $31, one of the parts (the subtractive change) is unknown, so the other part is the $16 she has left.
Comparison Problems. Comparison problems have typically been seen as difficult for children. This may partially be due to an emphasis on subtraction as developed in word problems that involve "take away" situations rather than finding the "difference" between two numbers. Interestingly, studies in countries that frequently use bar models have determined that students do not find comparison problems to be much more difficult than part-part-whole problems (Yeap, 2010, pp. 88-89).
A double bar model can help make comparison problems less mysterious. Basically, comparison problems involve two quantities (either one quantity is greater than the other one, or they are equal), and a difference between the quantities. Two bars, one representing each quantity, can be drawn with the difference being represented by the dotted area added onto the lesser amount. For example, given the problem:
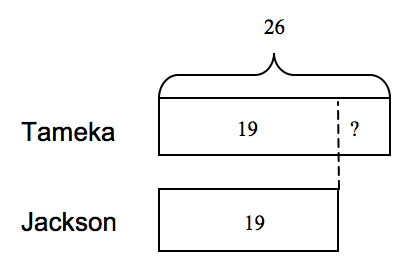
Tameka rode on 26 county fair rides. Her friend, Jackson, rode on 19 rides. How many more rides did Tameka ride on than Jackson?
Students might generate the comparison bars diagram shown below, where the greater quantity, 26, is the longer bar. The dotted section indicates the difference between Jackson's and Tameka's quantities, or how much more Tameka had than Jackson, or how many more rides Jackson would have had to have ridden to have the same number of rides as Tameka.
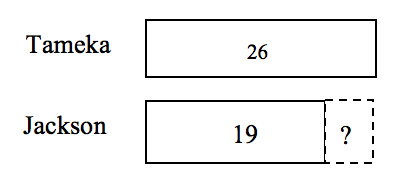
26 - 19 = ? or 19 + ? = 26; the difference is 7 so Tameka rode 7 more rides.
Comparison problems express several differently worded relationships. If Tameka rode 7 more rides than Jackson, Jackson rode 7 fewer rides than Tameka. Variations of the double bar model diagram can make differently worded relationships more visual for students. It is often helpful for students to recognize that at some point both quantities have the same amount, as shown in the model below by the dotted line draw up from the end of the rectangle representing the lesser quantity. But one of the quantities has more than that, as indicated by the area to the right of the dotted line in the longer bar. The difference between the quantities can be determined by subtracting 19 from 26, or adding up from 19 to 26 and getting 7, meaning 26 is 7 more than 19 or 19 is 7 less than 26.
Comparison word problems are especially problematic for English Learners as the question can be asked several ways. Modifying the comparison bars may make the questions more transparent. Some variations in asking questions about the two quantities of rides that Tameka and Jackson rode might be:
How many more rides did Tameka ride than Jackson?
How many fewer rides did Jackson go on than Tameka?
How many more rides would Jackson have had to ride to have ridden the same number of rides as Tameka?
How many fewer rides would Tameka have had to ride to have ridden the same number of rides as Jackson?
Comparisons may also be multiplicative. Consider the problem:
Juan has 36 CDs in his collection. This is 3 times the amount of CDs that his brother, Marcos, has. How many CDs does Marcos have?
In this situation, students would construct a bar model, shown below on the left, with 3 parts. Students could divide the 36 into 3 equal groups to show the amount that is to be taken 3 times to create 3 times as many CDs for Juan.
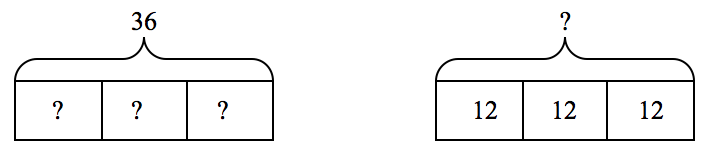
36 ¸ 3 = ? or 3 x ? = 36 12 + 12 + 12 = ? (or 3 x 12 = ?)
so Marcos has 12 CDs. so Juan has 36 CDs.
A similar model can be used if the greater quantity is unknown, but the lesser quantity, and the multiplicative relationship are both known. If the problem was:
Juan has some CDs. He has 3 times as many CDs as Marcos who has 12 CDs. How many CDs does Juan have?
As seen in the diagram above on the right, students could put 12 in a box to show the number of CDs Marcos has; then duplicate that 3 times to sow that Juan has 3 times as many CDs. Then the total number that Juan has would be the sum of those 3 parts.
Multiplication and Division Problems. The same model used for multiplicative comparisons will also work for basic multiplication word problems, beginning with single digit multipliers. Consider the problem:
Alana had 6 packages of gum. Each package holds 12 pieces of gum. How many pieces of gum does Alana have in all?
The following bar model uses a repeated addition view of multiplication to visualize the problem.
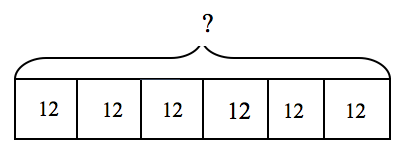
12 + 12 + 12 + 12 + 12 + 12 = 72 (or 6 x 12 = 72)
so Alana has 72 pieces of gum.
so Alana has 72 pieces of gum.
As students move into multi-digit multipliers, they can use a model that incorporates an ellipsis to streamline the bar model. For example:
Sam runs 32 km a day during April to get ready for a race. If Sam runs every day of the month, how many total kilometers did he run in April?
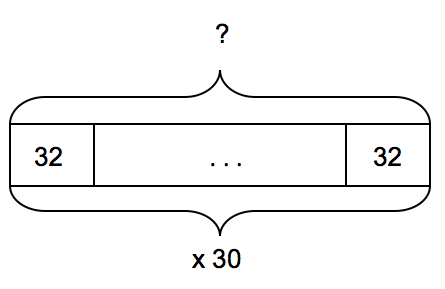
Sam ran 960 km during the 30 days of April.
Since division is the inverse of multiplication, division word problems will utilize the multiplicative bar model where the product (dividend) is known, but one of the factors (divisor or quotient) is the unknown.
Problems Involving Rates, Fractions, Percent & Multiple Steps. As students progress through the upper grades, they can apply new concepts and multi-step word problems to bar model drawings. Skemp (1993) identified the usefulness of relational thinking as critical to mathematical development. A student should be able to extend their thinking based on models they used earlier, by relating and adapting what they know to new situations.
Consider this rate and distance problem:
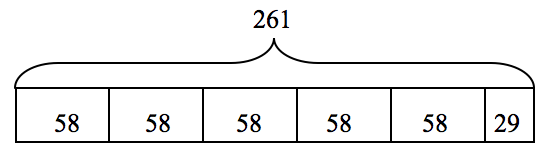
Phong traveled 261 miles to see her grandmother. She averaged 58 mph. How long did it take her to get to her grandmother's house?
The following model builds off of the part-part-whole model using a repeated addition format for multiplication and division. It assumes that students have experience with using the model for division problems whose quotients are not just whole numbers. As they build up to (or divide) the total of 261 miles, they calculate that five 58's will represent 5 hours of travel, and the remaining 29 miles would be represented by a half box, so the solution is it would take Phong 5½ hours of driving time to get to her grandmother's house.
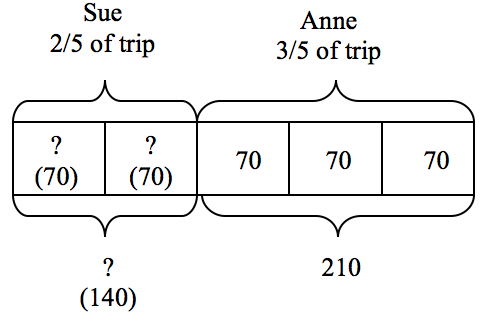
Even a more complex rate problem can be captured with a combination of similar models. Consider this problem:
Sue and her friend Anne took a trip together. Sue drove the first 2/5 of the trip and Anne drove 210 miles for the last 3/5 of the trip. Sue averaged 60 mph and Anne averaged 70 mph. How long did the trip take them?
There are several ways students might combine or modify a basic bar model. One solution might be the following, where the first unknown is how many miles Sue drove. A bar divided into fifths represents how to calculate the miles Sue drove. Since we know that the 210 miles Anne drove is 3/5 of the total trip, each one of Anne's boxes, each representing 1/5 of the trip, is 70 miles. Therefore, Sue drove two 70 mile parts, or 140 miles, to equal 2/5 of the total trip.
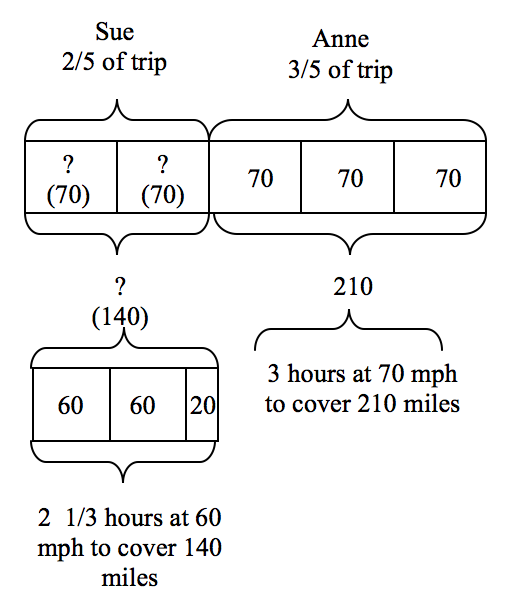
The diagram now needs to be extended to show how to calculate the number of hours. Anne's 210 mile segment, divided by her 70 mph rate will take 3 hours, as recorded on the following extension of the diagram. Sue's distance of 140 miles now needs to be divided into 60 mph segments to determine her driving time of 2 1/3 hours. So, the total trip of 350 miles would take 5 1/3 hours of driving time, considering the two driving rates.
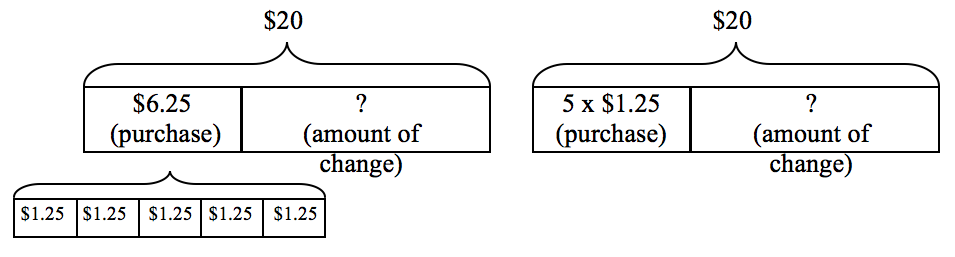
Consider a simpler multi-step problem:
Roberto purchased 5 sports drinks at $1.25 each. Roberto gave the cashier $20. How much change did he get back?
Again, there may be student variations when they begin to extend the use of diagrams in multi-step or more complex problems. Some students might use two diagrams at once, as show below on the left. Others may indicate computation within one diagram, as shown in the diagram on the right.
With routine experience with bar modeling, students can extend the use of the models to problems involving relationships that can be expressed with variables. Consider this simple problem that could be represented algebraically:
Callan and Avrielle collected a total of 190 bugs for a science project. Callan collected 10 more bugs than Avrielle. How many bugs did Callan collect?
Let n equal the number of bugs Avrielle collected, and n + 10 equal the number of bugs Callan collected. The following model might be created by students:
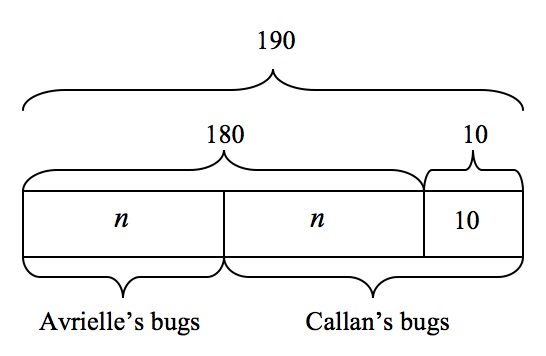
Since n + n = 180 (or 2n = 180), n = 90. Therefore, Callan collected 90 + 10 or 100 bugs and Avrielle collected 90 bugs for a total of 190 bugs collected together.
In using the model method, students have to translate information and relationships in words into visual representations, which are the models. They also have to manipulate and transform the visual representations to generate information that is useful in solving given problems.
Understanding the structure of a word problem involves knowing how the mathematical information in a given word problem is related, and how to extract the components needed for solving the problem. Tape diagram/Bar model drawings can help students become more proficient at identifying the variables involved in a problem as well as the relationship(s) between them. This ability to focus on the relationships among the numbers in a given problem, and to recognize the mathematical structure as a particular type of problem, is part of relational thinking - a critical skill for success in algebra. Building inverted-V and bar models into pre-algebraic work in grades K-7 can make students more powerfully ready for the formal study of algebra.
This is a GREAT site for problem solving practice - modeling problems with the tape diagram/bar model